Values and Custom Events Dashboard
The Values Dashboard is a reporting screen that allows you to surface information about values, both numerical and textual, that are associated with your tracking events.
Many of the events, whether it is a page view or a custom event, can have associated values. These values can be used to track revenue, engagement, or any other metric that you want to track.
The use cases for Values Dashboard are numerous. Here are a few examples:
- Revenue Tracking
- Engagement Tracking
- Conversion Tracking
- User Behavior Tracking, including buying behaviour
The Values Dashboard is also helpful in context of web applications when you want to analyze how your users are interacting with your application. For example:
- How many users are using a particular feature?
- How many files are people uploading?
- How long is the text they submit in a form?
- How many words?
- Which AI engine, or service was used?
An emerging use case includes also how people interact with AI chatbot. For example, you can track how many prompts are submitted before user leaves satisfied. Or perhaps you are curious about statistics with respect to prompts users submit:
- How many words?
- Which AI engine, or service was used?
Discover these and more insights with the Values Dashboard.
How to use the Values Dashboard
Before jumping into Values Dashboard, we recommend you get familiar with custom events and how they are being tracked.
To access the Values Dashboard, navigate to the Dashboard section in the left-hand menu and select Values Dashboard.
Here, you will be welcomed by three main sections:
- Values over time chart
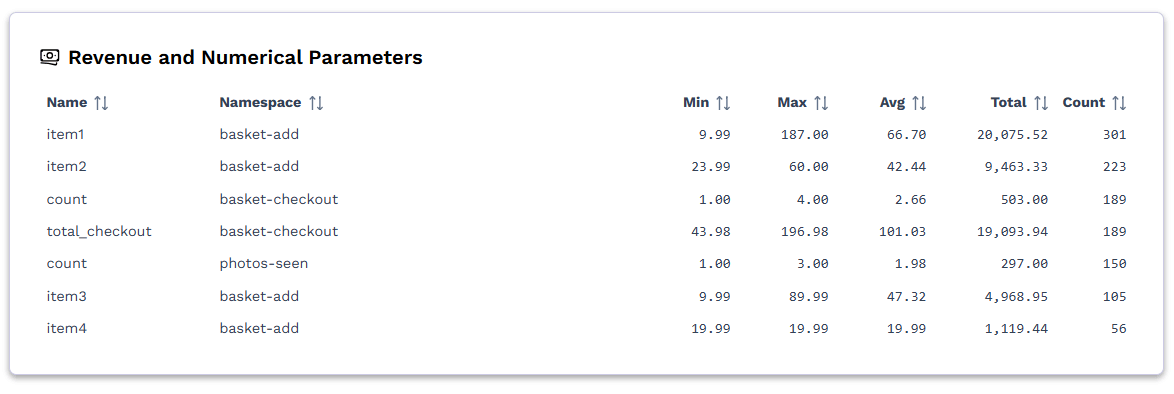
- Revenue and Numerical Parameters
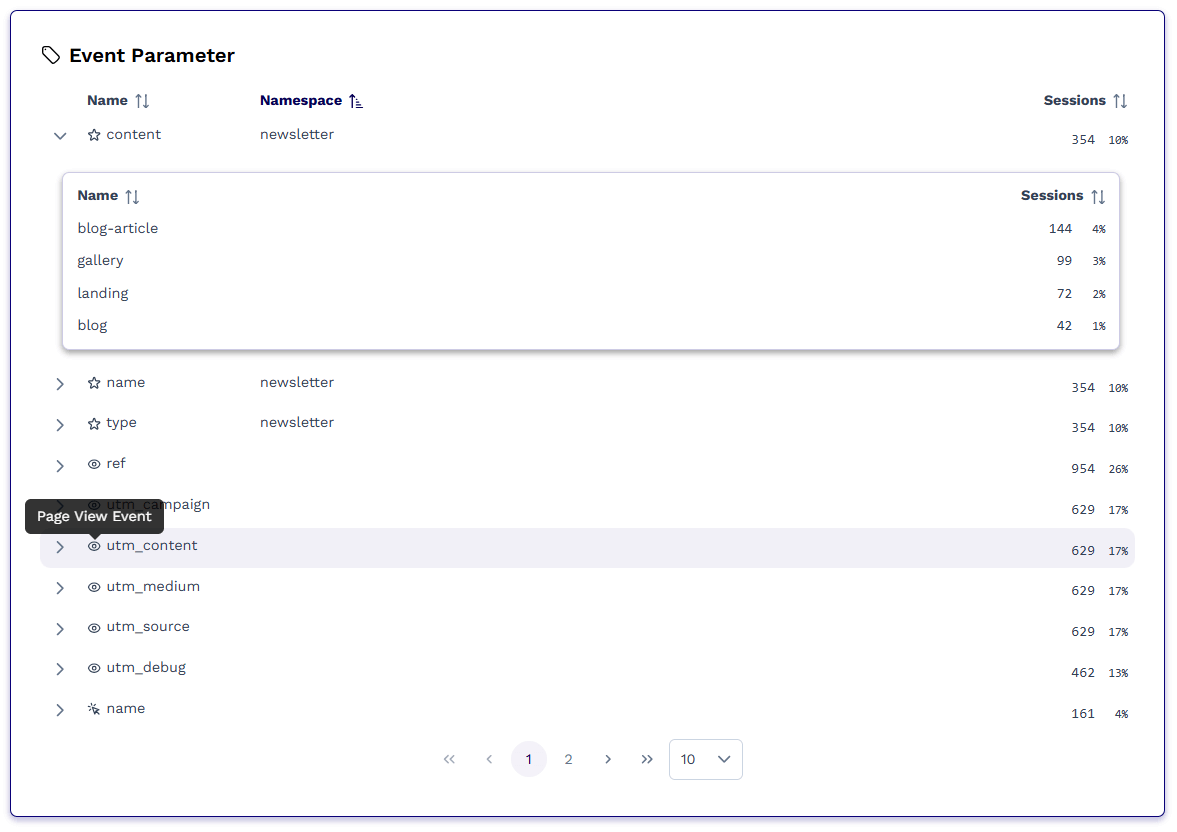
- Event Parameters
Values over time chart
Before you get started, use the dropdown menu to select an event parameter you want to visualize. The chart will display the values of the selected parameter over time.

You can switch between tracking minimum value, maximum value, average value, and sum of values. These values case represent number of items in the cart, the value of abandoned shopping session or a total amount at the successful checkout.
Revenue and Numerical Parameters
This data table list all numerical parameters that are being tracked. This can include things like basket items count, total basket value, number of uploaded files and any other information your website sent as Custom Event to Wide Angle Analytics. You can see the total sum of values, average value, minimum and maximum value.

Please note that we only show top 100 parameters, sorted by number of sessions they appeared in. That means that the sorting and pagination is limited to these top 100 parameters, and not applied globally.
Event Parameters
Event parameters deal with non-numerical values. These include campaigns, sources, referrals, name and other textual values that are being sent as part of the custom event.
 Each entry in the event parameters represent single parameter. Click a chevron on the left hand side to unfold the details of the parameter. You can see individual values for that given parameters and number of sessions they appeared in.
Similarly to values, this dashboard allows access to top 100 parameters, sorted by number of sessions they appeared in. That means that the sorting and pagination is limited to these top 100 parameters, and not applied globally.
Parameter Names
Parameters names reflect the value provided when issuing an event from your website. For example, a page view event for URL https://example.com/pricing?utm_source=google will have a parameter utm_source with value google. This applies to the following event type:
- Page View
- Page Leave
- Click Event
- Download Event
Custom Events, on the other hand, are named events. When your website code construct an event, the first parameters is the event name:
waa
  .dispatchEvent(
    "event-name",
    {
      "parameter1": "value1",
      "parameter2": "value2"
    },
    {
      "value1": 42,
      "value2": 3.14
    }
  );
The event name, which is event-name in the above example, will be as parameter namespace. In the Event Parameters and Revenue and Numerical Parameters tables, you will see namespace as a separate, sortable column.
In the Values Series section, the namespace is show as the parameter name prefix, followed by a colon, like namespace:parameter_name. For example, for event:
waa
  .dispatchEvent(
    "checkout",
    {
      "discount": "true"
    },
    {
      "total": 59.99,
      "discount": 10.0
    }
  );
The event parameters listed in the Values series will be checkout:discount and checkout:total.
Still need help? In that case please contact our support via, email or chat.