Visits and Users Dashboard
The Site Data View gives you access to multiple metrics, charts, and views. Here is a brief list of these and their meaning.
Summary
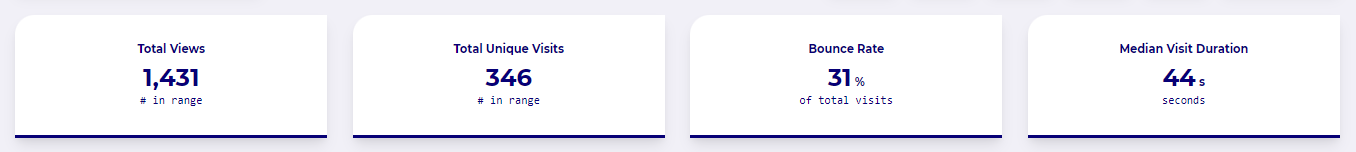
The first section of the dashboard gives you four critical data points. These are:
- Total page views count
- Unique visits count
- Bounce Rate
- Median visit duration
You will see the breakdown of these metrics into time series in the chart area.
Time Series
The time series section includes three charts:
- Page Views vs Unique Visits
- Bounce Rate
- Visit Duration
Page View vs Unique Visits
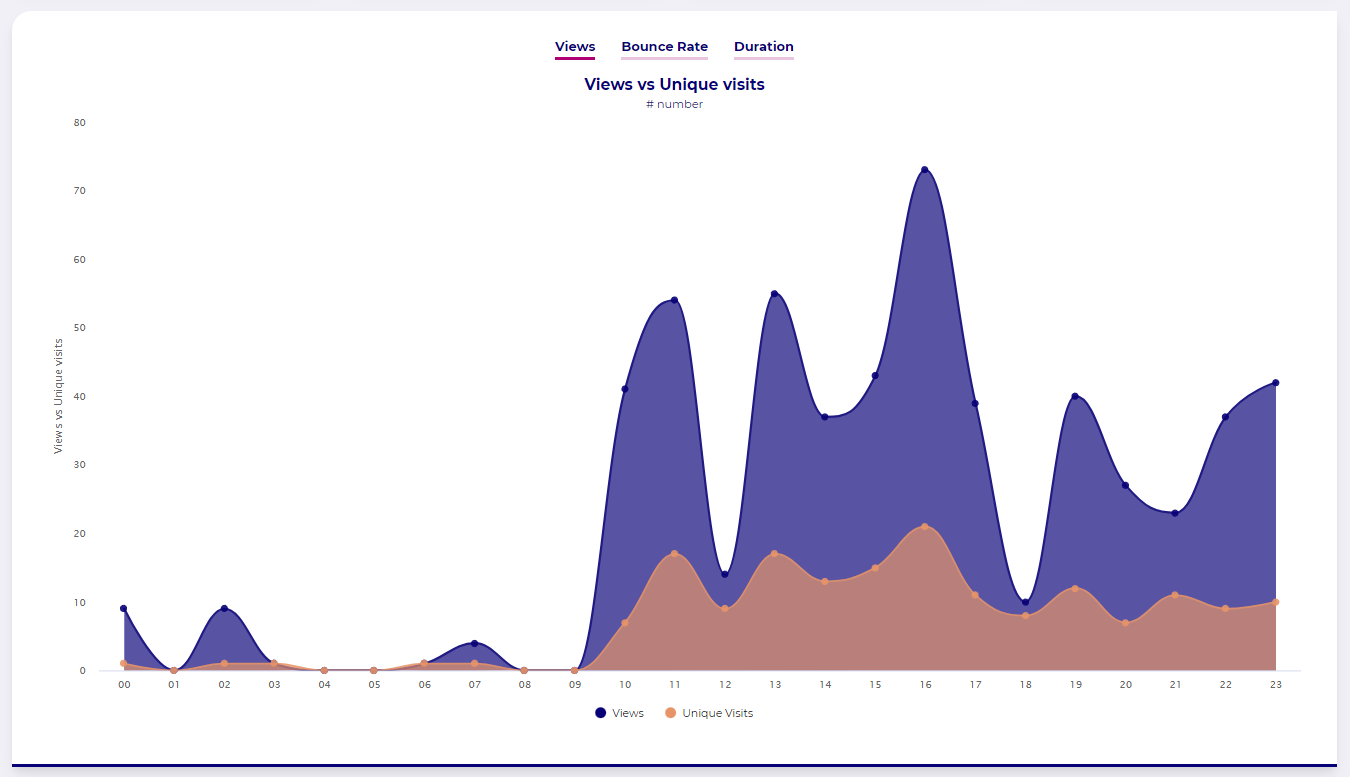
Views, or Page Views, represent every recorded click, website navigation or URL change, depending on the site’s configuration. For example, certain visits will be omitted from the statistics based on configured exclusions or URL fragments handling.
Unique Visits are the best possible approximation or number of unique visitors to your site.
A visitor is treated as a returning if his identifier is unique in a given time frame. You might observe this as changes to the number of unique visits as you adjust date ranges.
For example, let us look at the following scenario:
- the same user visits your site twice in two hours
- you are looking at analytics for a single day, which renders the graph with hourly aggregates
You will observe two unique visits across two hours in this scenario. At the same time, the Total Unique Visits counter will indicate only one.
Bounce Rate
The Bounce rate is measured as a percentage of visits that saw users leave after one view vs all other visits.
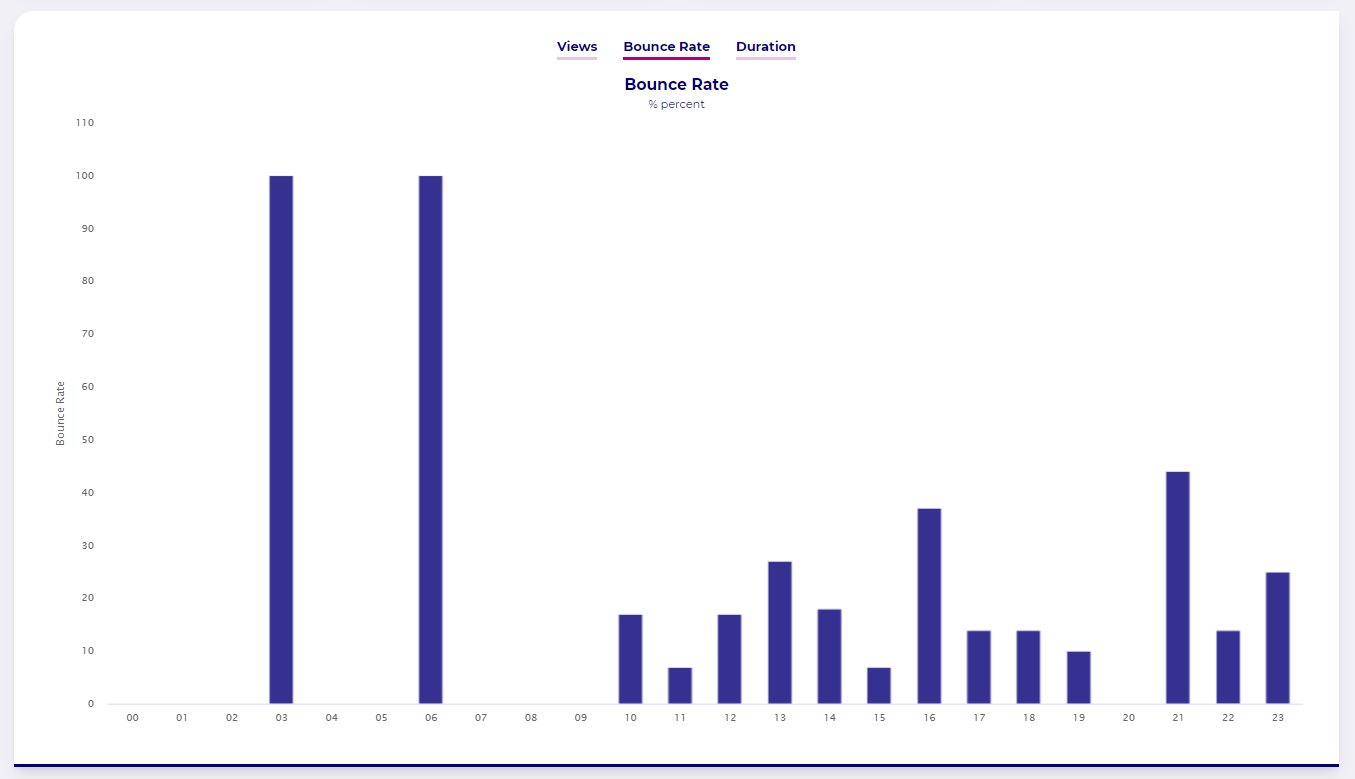
The bounce rate is associated with the visitor’s session, and the chart uses the session start, the first visit when applying the time range filter.
Duration
The duration chart presents the time visitors spent on your site. The Analytics service calculates duration from sessions that did not bounce, i.e., more than one view.
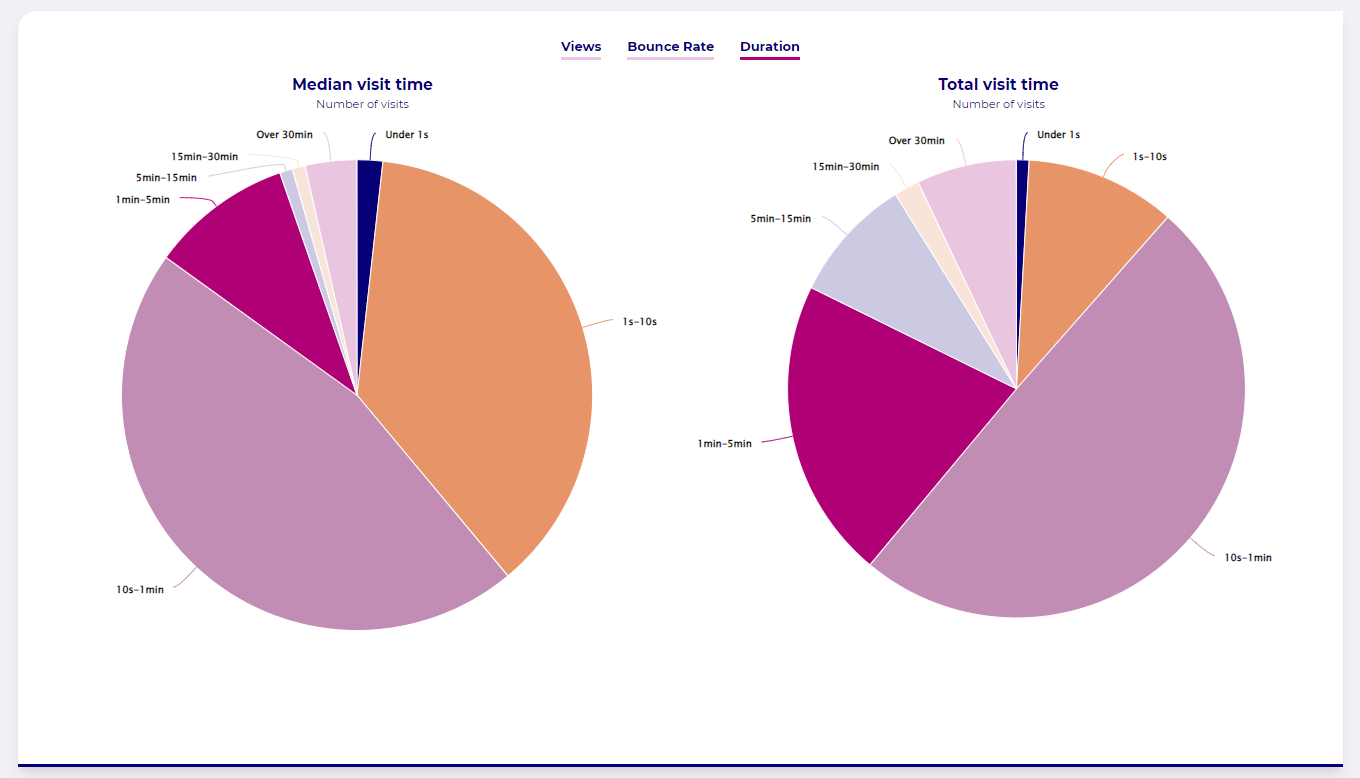
Charts include only sessions with their start matching the selected date range.
Our dashboard provides two pie charts. Both illustrate the number of visits that fall into a given visit duration range. However, they differ in how these ranges/buckets are defined.
The first pie chart uses the median visit duration. The median duration is calculated as the median value between page view events within one session.
The second chart uses the total visit duration. This time is approximated using the total time between the first and last page view event associated with the same visitor.
Map View
A map view is an interactive map. You can switch between Views and Unique visits by clicking on the legend.
You can click on the country to drill down to the region/province view for more details. Please note that the geographical location of your visitor is an approximation.
The map view does not render views from a location that cannot be attributed to known geography. If the visitor’s IP points to a specific country, but the province cannot be resolved, that visit will be counted on the country level but not visible in the drill-down.
This is significant as bots, and automated crawlers often use IP ranges not found in the lookup databases.
Data tables
Currently, we provide you with 7 data tables, listing the following statistics:
- Browsers
- Countries
- Sources
- Referrers
- Paths
- Operating Systems
- Device types
All data tables list four columns:
- Page Views count
- Percentage of total page views
- Unique visits
- Percentage of total unique visits
Top Sources
The Top Sources data table requires a bit of clarification. It is a value captured in either ref or utm_source URL parameter. The service will prioritize the ref parameter.
Filtering the view
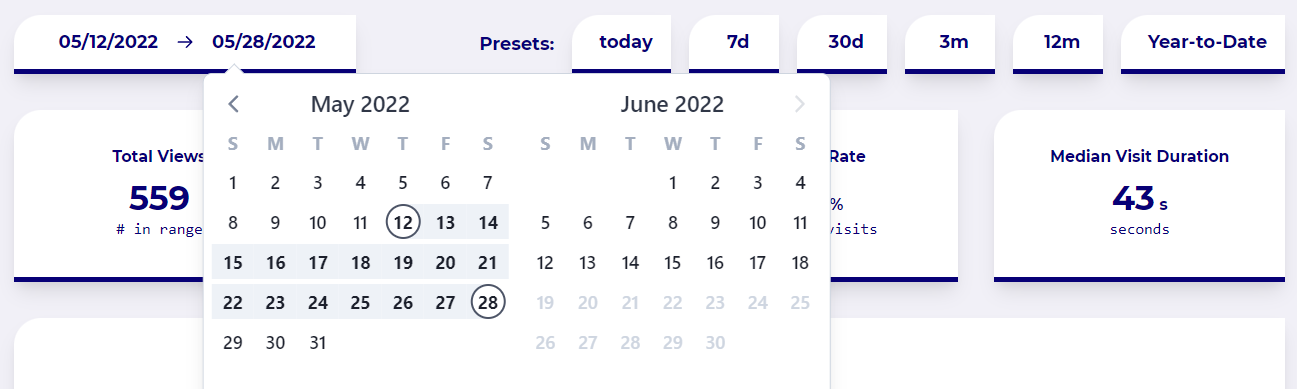
By date range
The first filter is available in the date range filter. Adjust date range using the range selector or pick one of the commonly used presets.
Data table filter
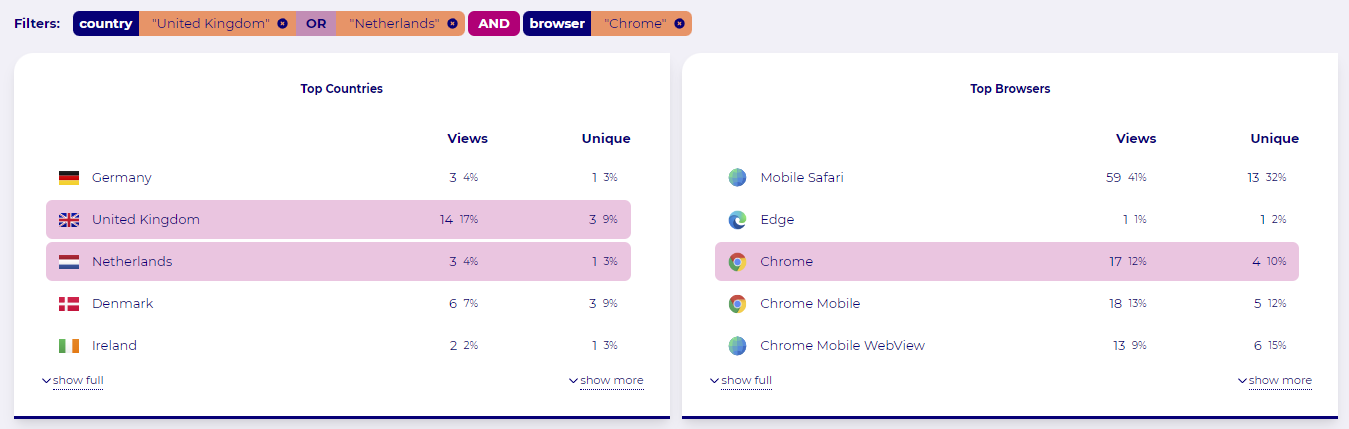
By selecting a value in a data table, you can filter the whole data set. In addition, you can click multiple values across multiple data tables to combine these filters to more complex expressions.
Multiple selections in the same table create a union. Meanwhile, selecting two different data tables will make an intersection.
For example, in the following selection, you are requesting analytics about traffic originating from:
Still need help? In that case please contact our support via, email or chat.